Volatility2_profile_identification_and_creation
February 2023 (700 Words, 4 Minutes)
Scanning for Windows Profiles and Creating Linux Profiles
Volatility is a handy and straightforward tool for memory forensics. That is the reason why it is most preferred by forensic analysts. In this blog, I will discuss how to detect the profile to use, given a memory image, and also how to create profiles for operating systems that do not have, one yet.
DETECTING A PROFILE FROM A MEMORY IMAGE
First things first, The VolatilityFoundation has released two different versions of volatility, Volatility2, and Volatility3. Profiles in this case are limited to volatility 2 in the context of usage. Let’s discuss what profiles are and understand why we need them to conduct memory forensics.
PROFILES
A profile in volatility is essentially a zip file that contains information on the kernel’s data structures and debugs symbols. Volatility uses this information to locate critical data in the memory and parse it once when found. This is unlike volatility 3 which uses symbol tables that we discussed earlier, that are generated based on the memory image itself.
WINDOWS PROFILES.
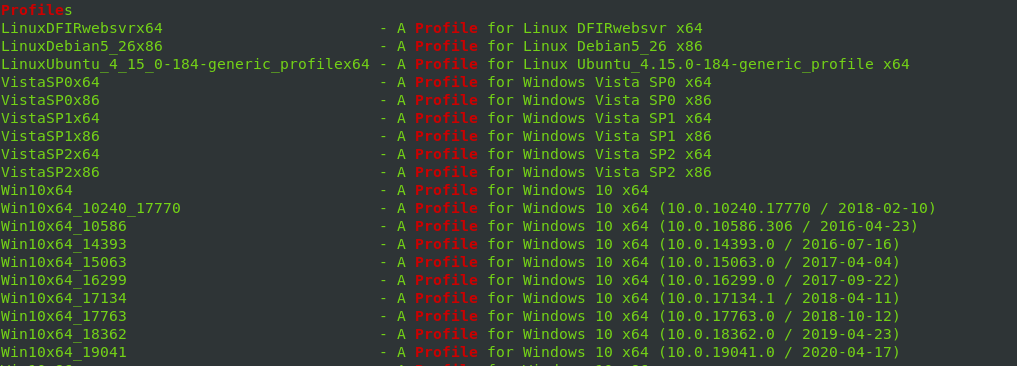
Luckily, a typical volatility2 installation will have several profiles that are pre-included for anyone to play with. The full list of these profiles can be found here or by running the command below:
vol.py --info | grep Profile
Results:
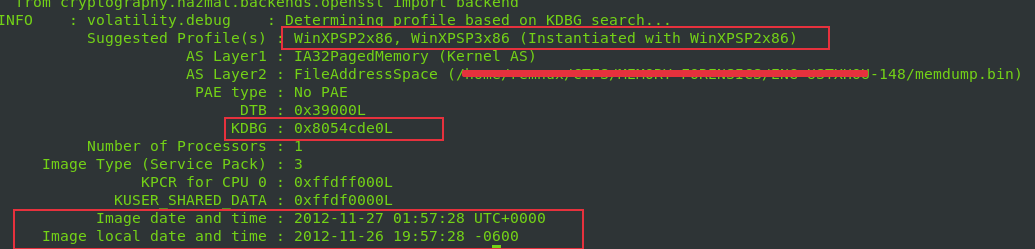
To detect which profile to use on a windows image, use the following command:
vol.py -f Test.mem imageinfo
This is the expected result for the above.
Wondering what a KDBG search is?

Well, here goes,a KDBG is a structure that is maintained by the windows kernel for the purpose of aiding developers in debugging. It includes information about running processes, system calls, and the state of the kernel. It is also useful to identify potential security issues by analyzing the operating system’s behavior.
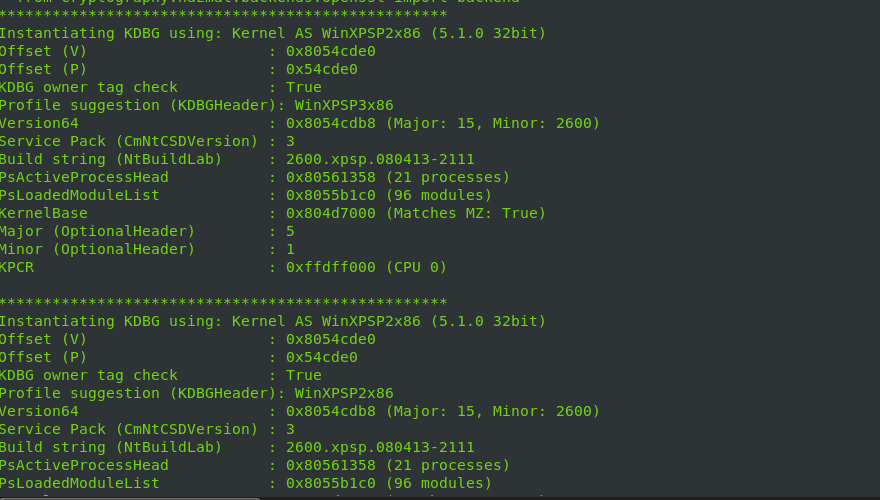
KDBGSCAN
Volatility has a plugin known as the kdbgscan, which, unlike imageinfo plugin which only prints estimated profile and less verbose info, identifies the correct profile and KDBG memory address from a memory image. The plugin scans the KDBGHeader signatures and compares them with those linked to volatility profiles while doing some sanity checks to reduce false positives. The plugin sometimes comes in handy in cases, especially with plugins such as pslist. Why? Pslist lists processes by finding the process list header which is pointed to by the KDBG. Sometimes a memory image has multiple KDBG and pslist might choose the wrong one (With 0 processes) since it takes the first one found in memory. It, therefore, fails to return any processes data To solve such a situation, use the kdbgscan plugin to identify the KDBG that contains processes.
LINUX PROFILES
Given a memory image from a specific Debian/ubuntu/any other Linux version, it is important to have a profile that works with the specific version. Unfortunately, volatility2 doesn’t ship with Linux profiles nor can we use the plugin imageinfo to identify which profile to use with a Linux memory image. So in this case, we have to create one that is specific to the Linux version we are working with. The important bits needed to create a working Linux profile are:
- Linux kernel headers
- System map file.
Lets Jump right into creating one. First, we need to install dwarfdump tool to help in creating kernel structures and vtypes. Install the tool by running the command:
Sudo apt-get install dwarfdump
Next, clone the volatility tool repo using the command:
git clone https://github.com.volatilityfoundation/volatility
Navigate to the directory /volatility/tools/linux and run the command
make
A dwarf file will be created on the current directory that we will use later on as part of the final profile.
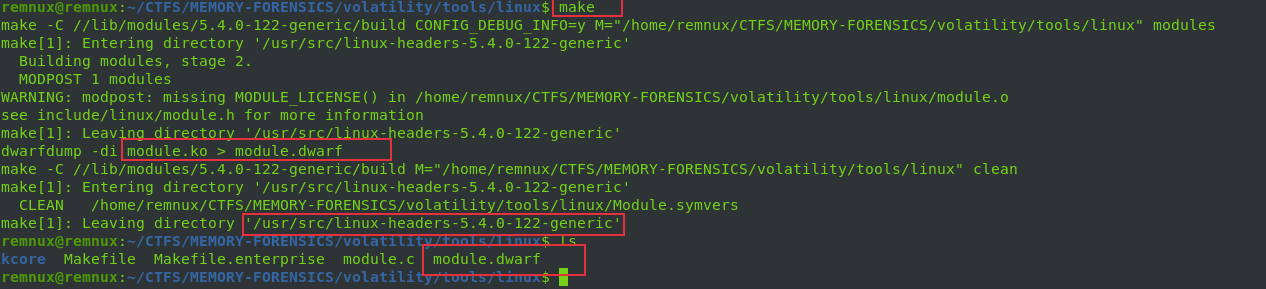
The next and final process is to zip the module.dwarf file and the System.map-* from the /boot/ directory in your Linux installation.
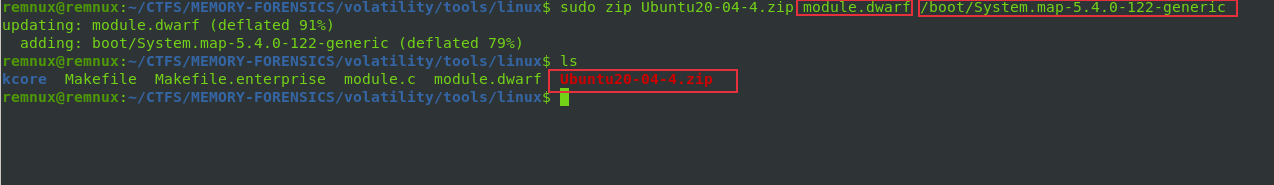
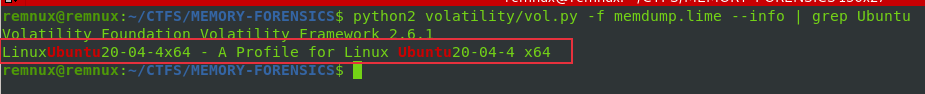
Now, that we have a profile that works with our Linux memory dump, copy the profile to the directory /volatility/volatility/plugins/overlays/linux directory. Next, confirm that the profile is being detected by volatility:
Vol.py -f memdump.lime –info | grep Ubuntu
We can then go ahead and test the profile on our memory image using some basic plugins:
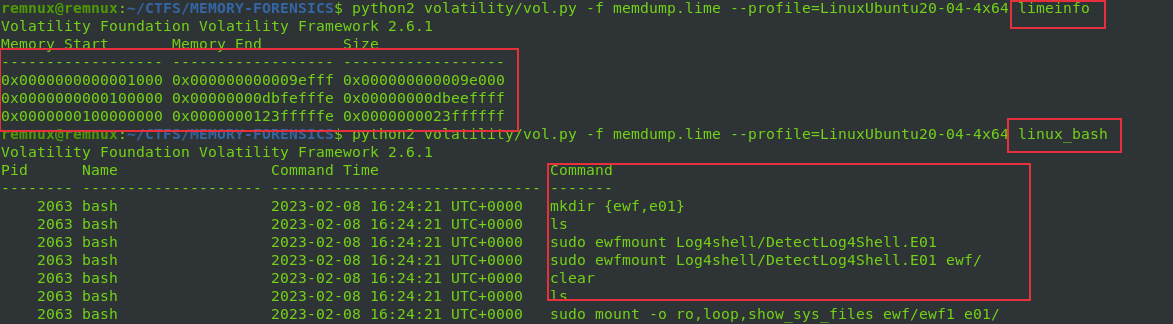
Congratulations!!, From the results above, we have achieved the task we set out to do.

CONCLUSION
If you wish to venture more into the intricacies of how volatility scans for a suitable profile. Some resources have been included below about, finding kernel global variables and some interesting read on how to read environment variables such as PROCESSOR_ARCHITECTURE and PROCESSOR_ARCHITEW6432. Who knows, might motivate you to script the next volatility or better detect plugins. Overall, the methods discussed above are fairly easy and fast to execute. You can try it yourself by dumping the volatile memory of your virtualized system, as we had previously discussed in this previous article. The next blog will cover how to make Linux symbol tables for volatility 3. Tune in :)